If you’ve been reading the comments of the previous blog post, you will have seen Bernard coded the simulation I described. You can play with it here. This simulation doesn’t answer the original ‘field problem’, but instead the more general problem of ‘can you see your friend if you’re both standing in a forest’?
{A quick note: if it appears to crash your browser, just force-quit because the code is in an infinite loop. This happens a lot with high wood density and low tree radius. On an ipad, force-quit by returning to the home screen then double tapping the home button and swiping the browser up to close it.}
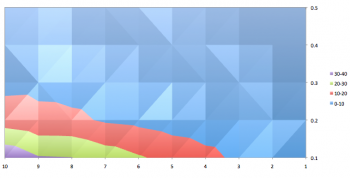
I’ve done some analysis using this early version of the simulation, and here’s a table of results:
That’s a surface plot of the percent chance to see your friend indexed by wood density (0.1 = 10% trees) and tree radius. A few comments:
– The distance between you and your friend is randomized.
– The tree position is randomized.
– The tree radii are unphysical, and the code doesn’t seem to support non-integer (cm) values.- I used 2500 trials each, except when radius was low (percentage ~ 0) where I dropped to 250.
Interestingly you can see the percent chance increases with tree size, but decreases with wood density. You are more likely to be able to see your friend if the trees are large, and less likely if they are close together. Currently there is no upper-bound on tree size, and it seems the percent chance simply increases as they get bigger and bigger.
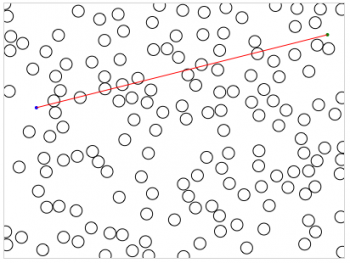
As for the distance question, I’m happy to report that Bernard also added metrics to help you calculate this. I’m going to pick 20% wood density and 7m tree radius (!!) as an example. Here’s a simple representational plot of one such forest complete with friends:
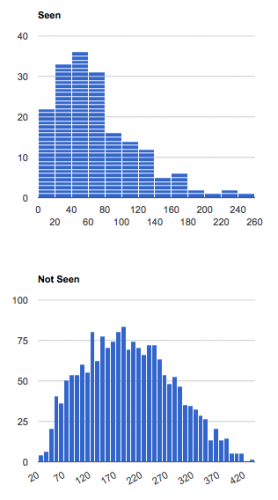
In the above – generated by the simulation – the friends are far apart and can’t see each other. The obvious question is what is the relationship between distance and ability to see each other, and here are the metric results from 1000 trials with these parameters:
We can’t read too much into these since position is randomly chosen, but on first glance it seems (in this case) the friends were more likely to see each other at about 50 meters. However if you look at the bottom plot, you’ll notice there were quite a few occasions around the 50m mark where they could not see each other. I’d estimate about 20 or so, which means only about a 60% chance (seen/total) of seeing each other at about 50m. Glancing at the two plots it is, as we’d expect, the case that the chance to see each other decreases with any distance beyond standing adjacent.
So the results are interesting, but these are early days yet. Were I to modify the current code, here’s what I would do:
– Input wood density input as an integer between 1 and 99
– Input tree radius in cm
– Output result plots as percent chances per distance – one plot, rather than two, of (times seen at that distance)/(total times separated by that distance)
– Add variable tree radii
– Add foliage transmission support- Make the map circular, and distribute the trees according to a Gaussian distribution (this is more physical) {This may be for V2.0}
If and when these adjustments are made, you may see part 3 of this post 🙂
–


I pushed version 1.2 which fixes the infinite loop and adds a log.
I’ll start thinking about version 2.0.